Lakehouse Accelerator – Wisconsin Databricks User Group
Data Engineering Panel – Wisconsin Databricks User Group
Data Scientist Panel – WI Databricks User Group
Wisconsin Databricks User Groups: Lakebase Operational OLTP Database
Wisconsin Databricks User Group Meetup – AI Agents in Databricks
Driving Financial Wellness Through Custom Digital Solutions

Discover how Xorbix delivered custom software development, cloud-based managed services, and BI solutions to streamline aid access for a fintech client.
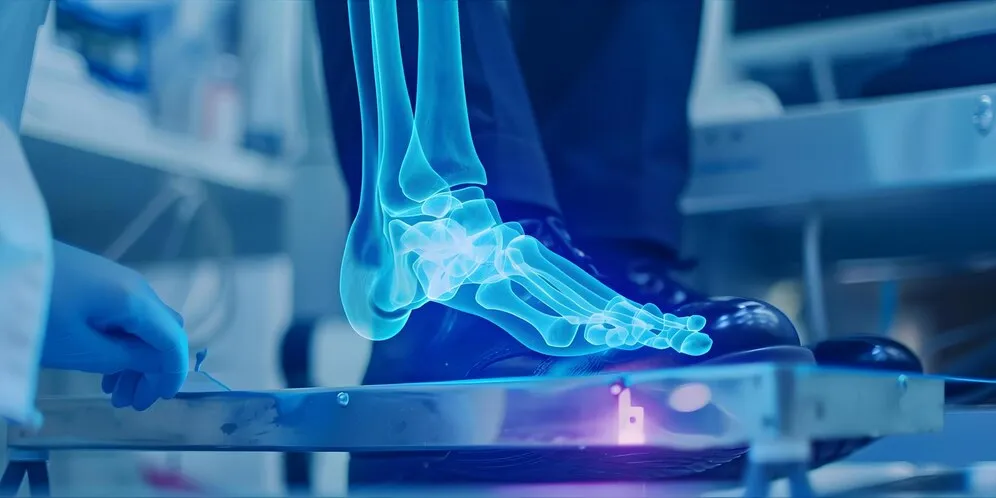
Modernizing Orthotics with TrueDepth Technology
Discover how Xorbix delivered custom software development, cloud-based managed services, and BI solutions to streamline aid access for a fintech client.
LLM Testing Solution Accelerator by Xorbix Technologies, Inc.
Databricks Data + AI Summit 2024 Insights – Wisconsin Databricks User Group
Building a Knowledge Base Chatbot – Data-Driven Wisconsin Presentation