How to Calculate POC Costs in Microsoft Fabric?
Author: Ryan Shiva
12 May, 2025
When choosing a data platform, cost and performance are crucial factors to consider, typically evaluated through a Proof of Concept (POC). In this blog, we will provide guidance and a tool to help you calculate costs from a POC using Microsoft Fabric and estimate your Total Cost of Ownership (TCO).
Evaluating Cost and Performance
Cost and performance are critical factors to consider when choosing a data platform, which are typically evaluated through a POC. In most cloud DWs you can calculate Cost Per Query as:
Cost per Query = # of Compute Units x Price per Compute Unit Per Hour x Duration in Hours As stated in Microsoft’s Synapse POC Playbook, using a Price/Performance metric like Cost per Query “provides a single comparable number for each performance test”.
Understanding Microsoft Fabric’s Pricing Structure
However, the equation is not as straightforward in Microsoft Fabric. Microsoft Fabric introduced a new pricing structure for data and AI workloads with capacity licensing and bursting. With the capacity licensing model, you select a fixed capacity size corresponding to a number of Capacity Units (CUs). Each CU represents different v-cores depending on the service (0.125 for Power BI, 0.5 for DW, or 2 for Spark). For example, an F64 capacity should provide up to 32 DW v-cores. However, with Bursting in Fabric, a Fabric warehouse can use up to 12X that capacity for queries, meaning up to 384 DW v-cores. While this may sound great in isolation, in production you will likely be running queries across many warehouses and lakehouses, a mix of ad-hoc, BI, and ETL and concurrency across 100s or 1000s of analysts, all of which can burst. While the cost gets smoothed over a 24-hour period, you will still need to pay it back over time. It’s like using Buy Now Pay Later – it helps you to make a big purchase they can’t afford right now (Bursting) but you still need to pay it off in regular installments over time (Smoothing).
To understand the true cost including bursting, you will instead need to calculate the Actual CUs used per query. According to Bradley Schacht from the Fabric CAT team, figuring this out today is “far more cumbersome than you’d like”. The Query Insights DMV provides query text and duration but not CUs consumed. The Capacity Metrics App provides CUs consumed but cannot be queried programmatically or drilled down to the query level easily.
Fabric POC Cost Analyzer Notebook
To address this, Xorbix Technologies built on the work of Bradley and Microsoft CSA Kristian Bubalo, who both used Semantic Link to query the Capacity Metrics semantic model. We developed a cost analyzer notebook that joins up this data with query insights to extract query-level duration, CUs, and query text and calculates actual vs. expected CUs, Bursting multiplier, and Actual vs. Expected Query Cost. This tool also recommends a Fabric Capacity size needed to execute queries without bursting, allowing you to estimate TCO for production scenarios.
POC Cost Analysis Example
To illustrate this, we tested using the Taxi Cab Azure Open Dataset, combining Yellow, Green, and For-Hire taxi datasets into a single ~50 GB nyc_taxi Lakehouse table. This dataset is suitable for analytics and BI use cases, representing a small data warehouse size typical for teams like HR or Finance.
Using an F8 capacity (4 DW v-cores before bursting), we ran 10 realistic SQL queries five times each, analyzing revenue patterns, trip durations, and location data for operational optimization and strategic planning. The results and cost analysis are here and below.
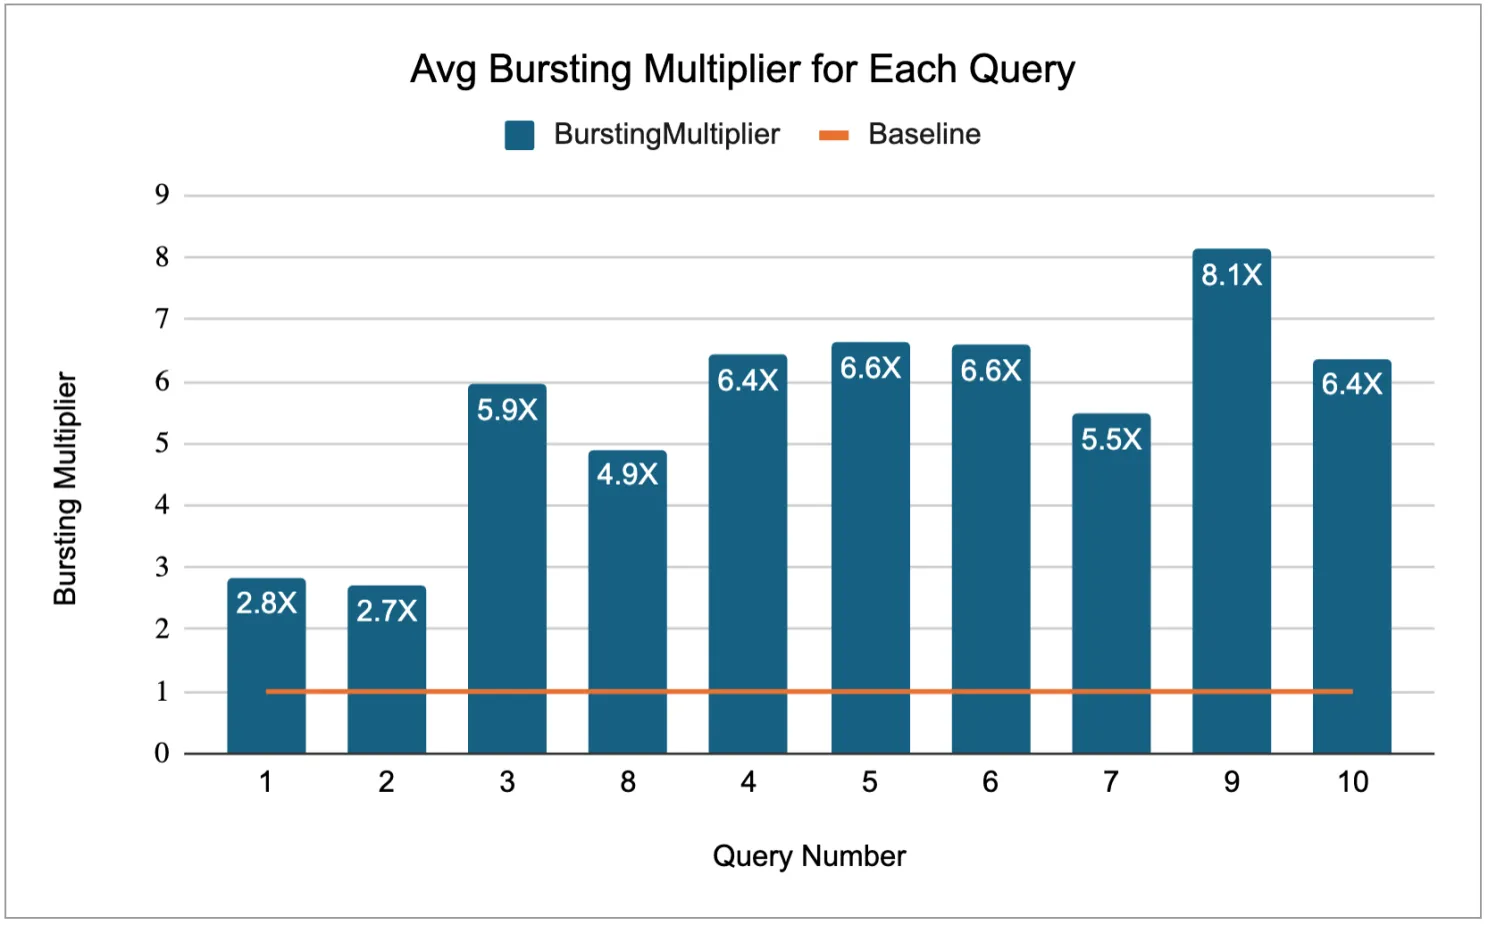
In the first chart, we see the average burst multiplier for each query. Running typical analytical queries against an F8 capacity on a 50 GB dataset resulted in burst multipliers from 2.7X to 8.1X, meaning Fabric allocated between 10.8 to 32.4 v-cores on average.
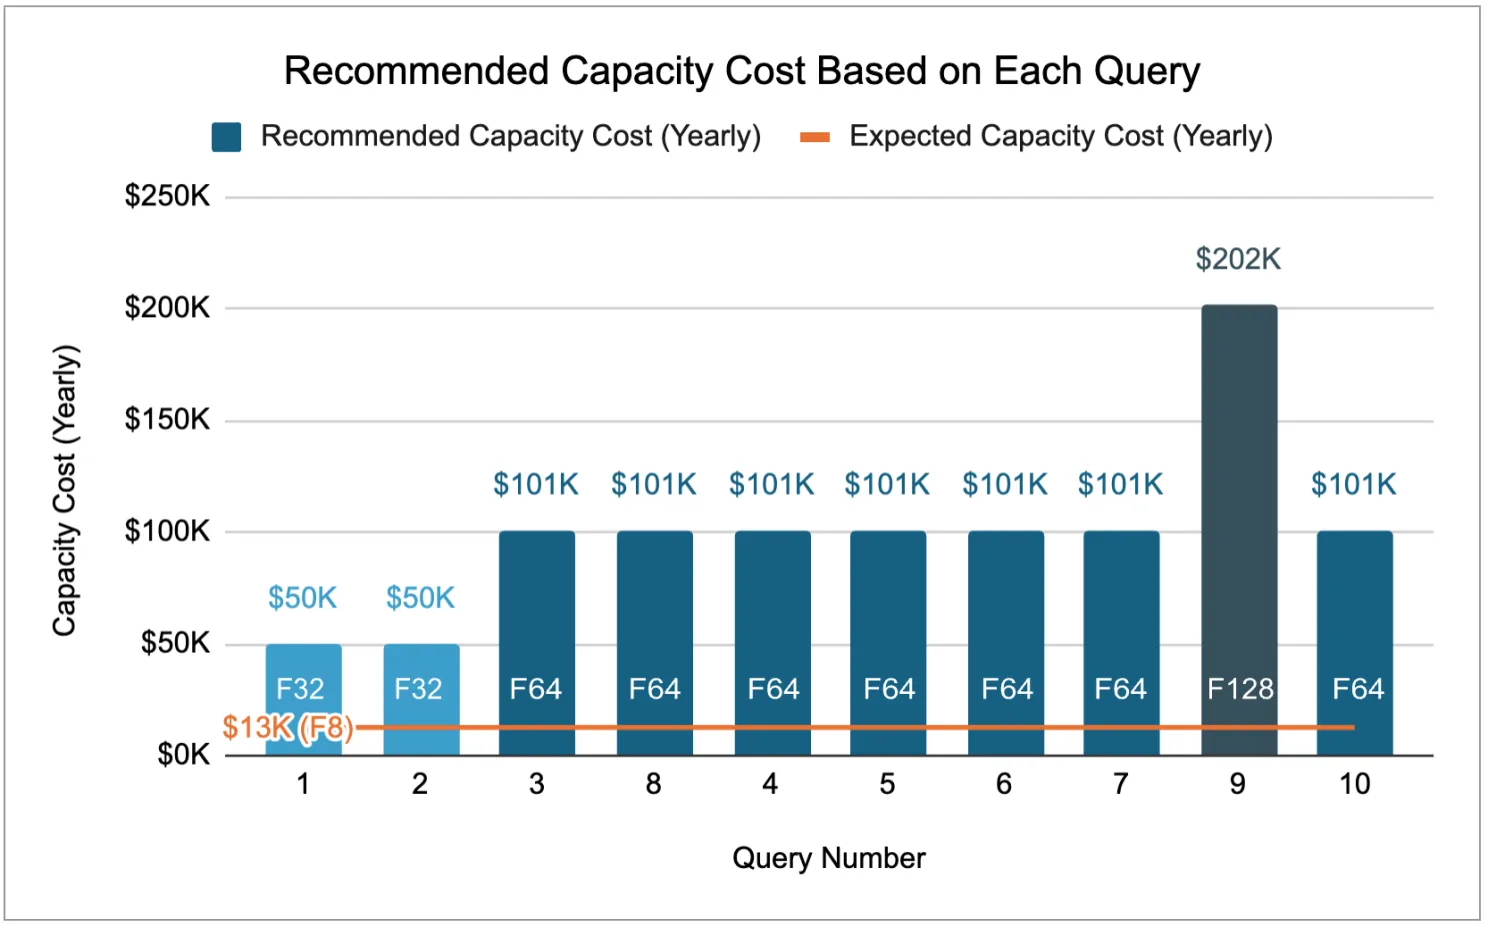
The second chart shows the real-world TCO of Microsoft Fabric. Due to the nature of all components (DW, ETL, BI) as well as OneLake data access requiring a running capacity, it is practically required to keep a Fabric capacity running 24×7. Keeping this in mind, the baseline F8 capacity costs ~$13K/year for West US 2. To avoid throttling in production, the tool recommended the capacities above based on each query’s burst multiplier. For example, Query 3’s 5.9X burst multiplier means it required 23.6 v-cores. Because there is no F47.2 capacity that would provide 23.6 v-cores, this is rounded up to an F64 capacity (32 v-cores).
Across the 10 queries, the recommended capacity size would be F64, representing a TCO of ~101K/year, significantly higher than the ~$13K/year expected for an F8 capacity. This example shows the true cost of maintaining a small 50 GB warehouse can be over 7.5X higher than expected without considering bursting. We hope this helps with your testing!
Other Considerations
Based on this, if I were part of a team evaluating Microsoft Fabric, would I find the platform straightforward to try out, configure, and secure? What should I know about the simplification of compute into shared Capacity Units (CUs) and its impact on enterprise governance, particularly regarding process visibility and cost planning for team or product workloads?
Do I need to factor in workload isolation from noisy neighbors and create multiple capacities? How about features like Power BI, Private Link, and CoPilot that require at least an F64 for each of those capacities?
Considering the different consumption rates of capabilities like Power BI, Spark, Data Warehouse, or OneLake within or externally from Fabric, how challenging is it to automate processes into trackable modules beyond the entire capacity or query-level grain?
Test out the cost analyzer notebook today in your Fabric evaluation, and let the Xorbix Technologies team know what you learned! For organizations seeking expert guidance on data warehouse optimization and cost management, explore our Data Warehousing & Data Analytics services. Our team can help you make informed cloud platform decisions and optimize your data infrastructure costs.
Read more on our related services: