Building a Scalable Geospatial Heatmap App on Databricks
Author: Aiden Vandenbush
7 April, 2026
Introduction
A client came to us with thousands of services spread across every ZIP code in the United States. They wanted to see what areas had plenty of coverage and what areas were underserved. Static tables and dashboards weren’t good enough. They wanted something fast, interactive, and geographic that would allow them to explore where their services were.
Our first instinct wasn’t to use Databricks for this problem. It is a great data engineering platform, but could it really be used to create a user-facing application? This project challenged that assumption.
We found that not only could Databricks solve this problem, but with Databricks Apps, we could have a data app fully deployed in a few hours.
The Problem: Understanding Services at Geographic Scale
The client already utilized Databricks dashboards, but they needed more. Static visualizations couldn’t support the exploratory, real-time interaction they needed. The team needed a way to quickly filter by service category, change between national and state views, and overlay extra information like population density.
The dataset made this particularly difficult. It included thousands of services across thousands of ZIP codes. We needed a way to quickly render all datapoints on a map. The tool also needed to be fast and responsive, or people wouldn’t use it.
Architecture: A Thin Application on Top of Databricks
The application follows a simple three-tier architecture:
- Frontend: A React application responsible for rendering maps and handling user interaction
- Backend API: A FastAPI service that handles requests and query orchestration
- Data Layer: Databricks SQL, backed by materialized views optimized for geospatial aggregation
The frontend never talks directly to Databricks. Instead, it calls REST endpoints exposed by the backend, which execute parameterized SQL queries using the Databricks SQL connector. This separation was intentional. SQL-heavy logic stays in Databricks where it can easily scale, the API remains lightweight and predictable, and the frontend focuses entirely on user experience.
Application Design: Frontend and Backend
The UI centers around an interactive map powered by the Google Maps API, providing basic interactions like panning, zooming, and hover tooltips.
A key design decision was supporting two visualization modes:
- Heatmap markers, where circular markers are color-coded by service density
- Polygon boundaries, where ZIP code shapes are rendered using GeoJSON
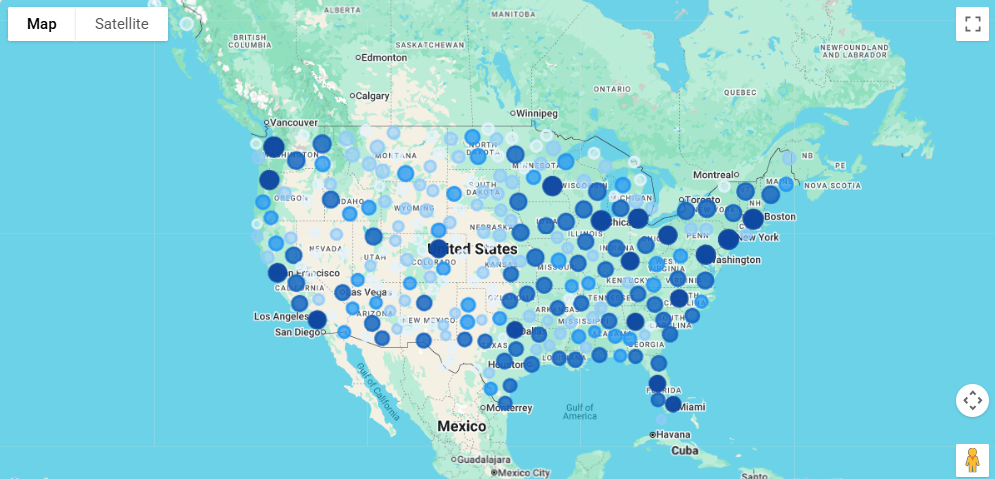
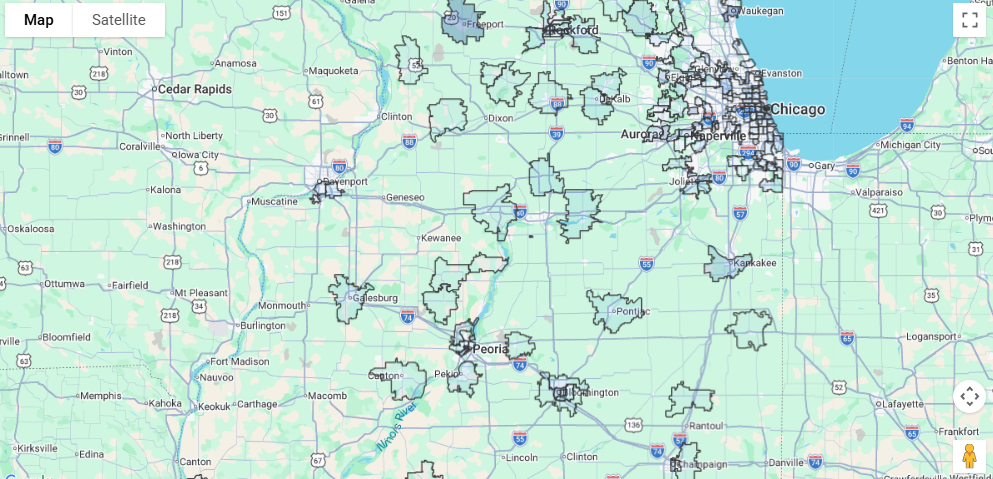
The heatmap markers are effective for identifying large-scale patterns, while polygon boundaries enable precise geographic review. This allowed us to support both general data exploration as well as more focused auditing, allowing the client to find both underserved regions and underserved ZIP codes.
The FastAPI backend exposes a small set of REST endpoints that coordinate queries and return results to the frontend. Since our data was already in Databricks, it was easy to handle all of the filtering, aggregations, and joins there as well. The backend simply passes parameters like service category and location to Databricks. This approach avoids unnecessary data movement and leverages Databricks’ distributed query engine.
Performance: What Actually Made It Fast
Performance was the hardest part of this project.
Early versions of the app were functional but slow, especially for national-level views. The biggest breakthrough came from introducing materialized views in Databricks. Instead of running expensive joins and aggregations on every request, service counts for each ZIP code were pre-computed and stored in materialized views. That single change reduced query times dramatically from minutes to seconds and made real-time interaction feasible.
Geospatial data required special care due to the large amount of ZIP code coordinates. ZIP code boundaries are stored as GeoJSON, but they’re only fetched when polygon mode is enabled. National-level polygon queries are capped to keep payload sizes manageable and avoid overwhelming the browser.
Deployment: The Biggest Surprise
Deployment was where Databricks Apps surprised us the most. A comparable setup would have required cloud infrastructure, a web server, environment variable management, and constant maintenance. Instead, we were able to define a simple app.yaml file and deploy the app with a single Databricks CLI command. Databricks Apps made this especially simple by allowing the backend and frontend to be deployed together as a single serverless application.
Within minutes, we had a live, publicly accessible URL. There was no complicated infrastructure to manage, and anyone with permission could open the app and start using it.
For a full-stack application backed by distributed compute, that level of simplicity was extremely nice to have.
Final Takeaways
This project changed how our team viewed Databricks. We came in treating it purely as a data engineering platform, and we left with a fully deployed, production-ready web application that a client could use.
What really made this project work was materialized views for query performance, a simple FastAPI backend layer, and Databricks app infrastructure handling all deployment overhead. Together, this allowed us to build and ship a great application in a fraction of the time a traditional stack would have required.
If your team already has data in Databricks, the barrier to building on top of it is lower than you think. You no longer need complicated infrastructure. The platform you’re already using can handle the application layer too.