A Field Study: Databricks Genie vs Microsoft Fabric
Author: Ben Schmirler
2 June, 2026
Recently I have been leading an assessment for a global industrial manufacturer comparing Databricks Genie against an already mature Microsoft Power BI/Fabric environment. Genie feels like an up-and-coming platform gaining significant momentum alongside more established incumbents. This blog summarizes the results of our comparative analysis across performance, cost, and platform capabilities.
Performance:
The question going into most Genie conversations is “Why would we need another analytics interface if we already own Power BI?” In this section, we will look at one reason organizations may consider Genie. As part of the evaluation, we tested Genie and Microsoft Fabric against 100 of the client’s most common reporting and operational business questions.
One representative example: “What are the top 5 underperforming production lines? And why?”
Results:
Fabric’s Power BI required a pre-built report with the correct filters already configured and returned the result in around 15 seconds. Genie turned a ranked table with the correct exclusions in under 8 seconds.
The biggest difference was consistency on complex, context heavy questions. Genie generally performed better with questions that required cross domain reasoning and large underlying datasets. Fabric performed well for structured reporting scenarios and predefined semantic models, but accuracy dropped more noticeably when users asked broader follow-up questions or phrased requests conversationally. One consistent observation was that Genie handled iterative questioning more naturally, and users could refine questions progressively without needing to completely restructure the prompt or return to a dashboard workflow. Overall, both platforms performed well on traditional reporting queries with marginal execution difference of a .8 second across the defined test queries.
Total Cost of Ownership:
An interesting finding from our client evaluation was how quickly the economics changed as user counts scaled. At smaller deployments, Power BI Pro remained the clear cost leader due to its simplicity and low per-user licensing model. But as we modeled broader organizational adoption, especially operational users engaging through conversational analytics instead of traditional dashboard consumption, the gap narrowed significantly. At 500 users, the gap clearly showed Genie as the more economical option. The takeaway was that conversational analytics changes the scaling economics considerably once organizations move beyond small groups of Power BI/Fabric users and start enabling broader business engagement across large operational teams. The below data and chart show the results of our study using a Fabric F2 instance and a Medium SQL Warehouse instance.
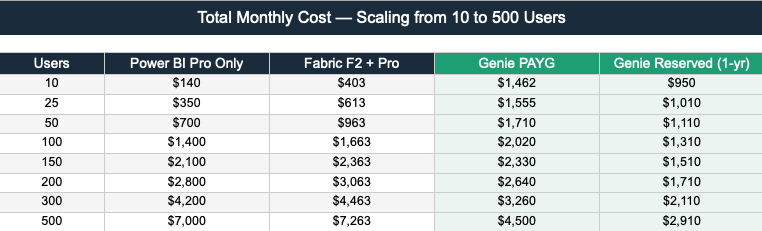
Figure 1: Cost By User Count
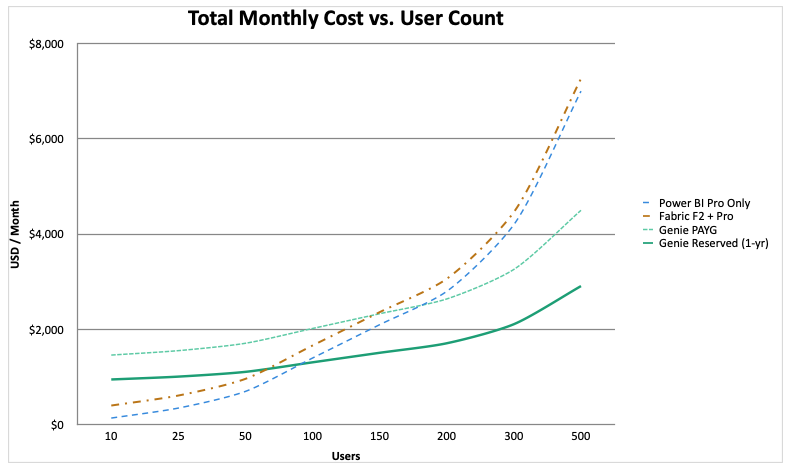
Figure 2: Diagram of Cost as User Base Increases
Capability:
An interesting outcome from our evaluation with the client was how differently the platforms scored depending on the category being measured. Power BI/Fabric consistently performed better in traditional self-service BI and setup simplicity, which aligns with its maturity and broad business adoption. But Genie separated itself significantly in natural language interaction, large-scale data handling, and AI/ML integration against enterprise data. The scores reinforced that traditional BI tools are still excellent for curated reporting and dashboard-heavy workflows, while Genie feels optimized for conversational analytics at scale. I recognize that 4 out of the 6 dimensions closely align with Databricks’ core strengths. The dimension weighting reflects this client’s priority use cases and requirements and is also closely aligning to where the industry is trending with a heavy AI focus.
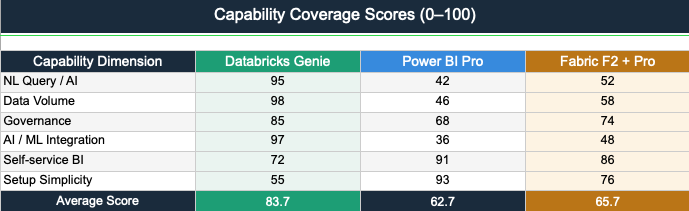
Figure 3: Capability Scores
Figure 4 clearly illustrates the strengths of each tool.
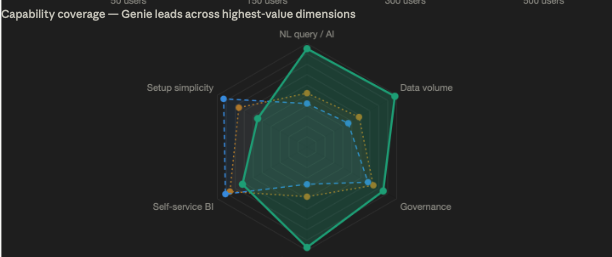
Figure 4: Capability Matrix
No tool will be the perfect match for every company. Organizations should carefully define the evaluation criteria that matter most to their business objectives, user adoption patterns, and long-term analytics strategy before selecting a platform. In this particular case, the client is heavily pursuing the conversational elements in Databricks Genie to capture untapped business opportunities.
In the end, this assessment was less about determining a universal “winner” and more about understanding how analytics consumption patterns are changing inside large global enterprises. Power BI and Fabric remain strong platforms for curated dashboards, executive reporting, and traditional self-service BI workflows. Those strengths were very evident throughout the evaluation.
What stood out with Genie, however, was how differently business users interacted with data once conversational analytics entered the picture. Users who historically consumed reports only occasionally became much more engaged when they could ask iterative business questions naturally instead of navigating and building complex dashboards.